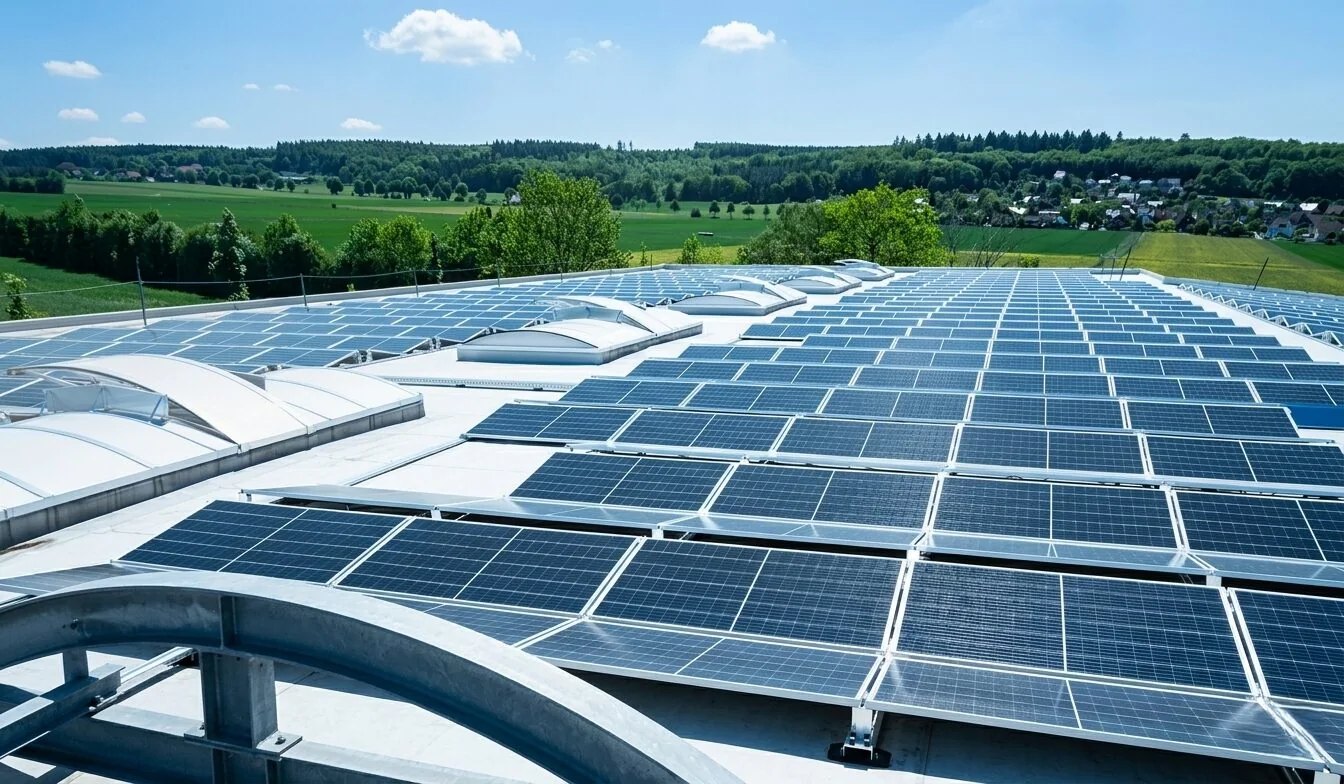
3 MW / 12 MWh battery storage with a 3.7 MWp solar field. Charges from own solar at midday, when Ukrainian wholesale prices collapse towards zero, and sells into the evening peak.
Complete project documentation for institutional and retail investors. Every figure below is derived from the financial model summarised on this page; primary sources are listed at the end.
1. Executive summary
A 3 MW / 12 MWh lithium-iron-phosphate battery co-located with a 3.7 MWp ground-mounted solar field in Odesa oblast. This is the entry configuration of the programme: it sits exactly at the eligibility limit of Ukraine’s new solar-plus-storage auction category, is small enough to stay below the 5 MW storage-licensing threshold, and is designed to be replicated. The battery — not the solar field — is the profit engine; the solar field exists to supply roughly two thirds of the charging energy behind the meter and to qualify the project for auction support.
Key investment metrics
€5,301,450Total capital cost
9.6%Equity IRR (levered)
1.37xMinimum DSCR
€1,855,508Equity tranche
€3,445,942Senior debt (65%)
€651,395Year-1 EBITDA
9.1%Project IRR (unlevered)
€-316,432NPV at 10% discount rate
8.8 YearSimple payback
€95/MWhLevelised cost of storage
20 YearDesign life
€12,907,932Cumulative 20-year EBITDA
2. Investment thesis: how the asset earns
Ukraine now has one of the most extreme intraday price curves in Europe. Distributed solar has grown fast enough to push midday wholesale prices to near zero, while evening demand still has to be met by scarce dispatchable capacity at prices approaching the regulatory cap. The asset is built to monetise exactly that gap.
1
Charge at midday
Between roughly 10:00 and 16:00 the solar field feeds the battery behind the meter. Any shortfall is topped up from the grid at the midday trough price, which on the reference day was under €7/MWh.
2
Hold through the shoulder
The battery sits full through the late-afternoon ramp while grid prices climb. A four-hour system can hold a complete charge rather than being forced to discharge early.
3
Discharge into the evening peak
Between 19:00 and 23:00 the full 12 MWh (20 MWh for the larger project) is sold into the day-ahead and intraday markets at the daily maximum.
4
Stack ancillary revenue
Outside the arbitrage window the inverter can provide frequency restoration reserve to Ukrenergo, which is procuring several hundred MW of aFRR for the 2026–2030 period.
Observed arbitrage spread
Charging window Discharge window
€1/MWhCheapest 4 hours
€236/MWhMost expensive 4 hours
€235/MWhPeak-to-trough spread
€111/MWhDaily average
115xEvening / midday ratio
Day-ahead prices for the UA-IPS bidding zone, delivery day 1 August 2026. The daily average of €110.9/MWh is close to the 2025 full-year average of €103.8/MWh, so this is a typical price level with an extreme shape rather than an outlier day.
Why four hours, not two
Our first pass modelled a two-hour battery and produced an unattractive 5.4% equity IRR. The reason is structural: with only two hours of storage the majority of the solar field’s output has to be sold unstored, into the very midday hours when Ukrainian prices collapse to almost nothing. Unstored midday solar in Ukraine is close to worthless. Extending duration to four hours stores nearly all of it, lowers the battery’s cost per kWh, and roughly doubles the levered return. The solar field is deliberately sized no larger than auction eligibility permits, because incremental solar capacity beyond the battery’s absorption capacity adds capital cost without adding meaningful revenue.
3. The Ukrainian electricity market
Ukraine’s wholesale market has operated on an EU-style day-ahead, intraday and balancing model since 2019, and the grid has been synchronised with Continental Europe since March 2022. Three features make it unusually attractive for storage.
Extreme intraday volatility
Wartime damage to dispatchable generation, combined with rapid distributed solar growth, produces a peak-to-trough spread that regularly exceeds €200/MWh — several times the spread available in Germany or Poland.
A high and rising price ceiling
From 1 May 2026 the regulator set a single cap of ₴15,000/MWh on the day-ahead and intraday markets and ₴17,000/MWh on the balancing market, replacing the previous time-differentiated caps. The floor on the day-ahead market is ₴10/MWh, so the arbitrage window is wide in both directions.
Explicit policy support for storage
Ukraine has legislated a dedicated solar-plus-storage auction category, is tendering 1,505 MW of new flexible capacity, and exempts imported storage and solar equipment from VAT and customs duty.
Monthly day-ahead BASE price index
Monthly BASE index published by the Market Operator, ₴/MWh. Gaps are months for which we did not obtain the official bulletin; they are shown as gaps rather than interpolated. Bars marked with a dot are part-month figures. Note the winter premium — December 2025 and February 2026 are the strongest months for an evening-discharging asset.
2025 full year benchmarks
Metric
₴/MWh
€/MWh
BASE price index
5,292
€104
Weighted average trade price
5,644
€111
Highest daily price
8,221
€161
Lowest daily price
2,446
€48
Regulatory price caps
Metric
₴/MWh
€/MWh
Day-ahead and intraday market, maximum
15,000
€294
Balancing market, maximum
17,000
€333
Day-ahead and intraday market, minimum
10
—
Caps in force 1–30 April 2026
Time window
Day-ahead and intraday market, maximum
Balancing market, maximum
00:00–07:00, 11:00–17:00
5,600 ₴
6,600 ₴
07:00–11:00, 23:00–24:00
6,900 ₴
8,250 ₴
17:00–23:00
15,000 ₴
16,000 ₴
The April 2026 time-differentiated structure is shown for context because it illustrates how deliberately the regulator has priced the evening window: the 17:00–23:00 cap was already ₴15,000/MWh when the midday cap was ₴5,600/MWh.
Ancillary services
Ukrenergo held a supplementary auction for the 2026–2030 supply period covering 472–555 MW of charge-direction automatic frequency restoration reserve and 201–252 MW of symmetric product. Batteries are eligible. We have credited only a conservative amount of ancillary revenue in the base case because a firm cleared price for these products is not public; contracted aFRR is treated as upside in the optimised case.
4. Technical configuration
The configuration is deliberately conventional: containerised LFP cells from a tier-one supplier, a four-hour discharge duration, and a single shared grid connection point behind which both the battery and the solar field sit.
Metric
Value
Battery power rating
3 MW
Battery usable energy
12 MWh
Discharge duration
4 h
Solar field capacity
3.7 MWp
Land requirement
5.9 ha
Cell chemistry
Lithium iron phosphate (LFP), containerised
Round-trip efficiency, AC–AC
90%
Equivalent full cycles per year
330
Battery capacity fade
2.0% per year
Solar module degradation
0.45% per year
Solar specific yield
1,300 kWh/kWp
Design life
20 Year
Augmentation strategy
None assumed; 20-year supplier capacity warranty relied upon
Year-1 energy balance
Solar generation4,810 MWh
Solar routed to battery2,982 MWh
Grid charging at midday trough1,418 MWh
Solar sold directly1,828 MWh
Battery energy delivered to grid3,960 MWh
Share of charging met by own solar
68%
Cumulative 20-year EBITDA
65,814 MWh
The battery is charged predominantly from the co-located solar field. The residual is imported from the grid during the midday trough, which is economically attractive rather than a shortcoming: buying at the trough price plus transmission still leaves a spread of over €160/MWh.
5. Capital expenditure
The build-up below is benchmarked against three independent references: the BloombergNEF 2025 system cost survey (Europe average €154/kWh), Ember’s bottom-up build for markets outside China and the US, and the only large published Ukrainian comparator — DTEK’s 200 MW / 400 MWh project at an implied €313–350/kWh. Our figures sit deliberately between the European benchmark and the Ukrainian comparator.
Battery system — enclosures, PCS, EMS, fire suppression, civil and electrical works€2,280,00043.0%
Solar field — modules, inverters, mounting, cabling, civil works, EPC€1,979,50037.3%
Development, permitting, legal and tax structuring, owner’s engineer, financing fees€400,0007.5%
Grid connection and external works€160,0003.0%
Contingency (10%)€481,9509.1%
Amount / Share
Metric
Value
Total
€5,301,450
Battery system cost
€190/kWh
Solar field cost
€0.535/Wp
Import VAT and customs duty
Exempt for solar and storage equipment (Laws 3853-IX and 3854-IX)
Imported storage and solar equipment is exempt from both VAT and customs duty in Ukraine, an exemption extended in December 2025. This is the single largest fiscal lever in the model and is reflected in the figures above. The grid connection line is an allowance: the definitive cost is fixed only when the distribution system operator issues technical conditions, and is flagged as an open item before final investment decision.
6. Revenue model and operating costs
Revenue has three components. Arbitrage on the battery dominates; direct solar sales are modest by design, because the hours in which unstored solar can be sold are precisely the hours when Ukrainian prices are lowest.
Metric
Amount
Note
Battery arbitrage — energy delivered into the evening peak
€811,800
3,960 MWh × €205
Direct solar sales outside the charging window
€58,496
1,828 MWh × €32
Ancillary services and balancing
€29,994
—
Total year-1 revenue
€900,290
Price assumptions
Metric
€/MWh
Evening discharge capture price
€205
Midday charging cost
€25
Direct solar capture price
€32
These are annual averages, and all three are conservative against the reference day, on which the top four hours averaged €236/MWh and the cheapest four averaged €0.7/MWh. We assume the asset captures €205/MWh on discharge rather than the €236/MWh observed, and pays €25/MWh to charge rather than near zero, to allow for winter months when the midday trough is shallower and for imperfect forecasting.
Operating costs, year 1
Metric
Amount
Battery operations and maintenance (2% of battery capex)
€45,600
Solar field operations and maintenance (€9/kWp)
€33,300
Insurance (0.4% of capital cost)
€21,206
Physical security and site protection
€35,000
Asset management and SPV administration
€40,000
Land lease
€2,655
Total operating costs
€177,761
Transmission charges of ₴713.68/MWh (about €14/MWh) on grid-imported charging energy and market operator fees on delivered energy are modelled separately within EBITDA and are not shown in the table above.
From revenue to EBITDA
€900,290Total year-1 revenue
− €177,761Total operating costs
€651,395Year-1 EBITDA
7. Returns, financing and sensitivity
We present three scenarios rather than a single number. The base case is fully merchant and assumes commercial debt pricing; we regard it as the honest floor. The optimised case reflects the financing structure every comparable Ukrainian transaction has actually used.
Base case — merchant, commercial debt
Project IRR (unlevered)9.1%
Equity IRR (levered)9.6%
Minimum DSCR1.37x
Simple payback8.8 Year
Fully merchant revenue, 65% gearing at 8.5%, 330 cycles per year, only nominal ancillary income.
Optimistic case — weather-independent grid blending
Project IRR (unlevered)11.9%
Equity IRR (levered)15.4%
Minimum DSCR1.66x
Simple payback7.3 Year
Year-1 revenue uplift+19.2%
The battery cycles every day regardless of local weather, because on dull days it charges from the grid at the midday trough instead of from its own array. Financing is unchanged from the base case, so the uplift here is purely operational.
Downside case — auction CfD floor
Equity IRR (levered)11.2%
Minimum DSCR1.44x
Solar output contracted at the €120/MWh auction ceiling and battery capture cut to €170/MWh. This is the scenario in which merchant spreads compress but state support holds.
Capital structure
Metric
Value
Total capital cost
€5,301,450
Equity tranche
€1,855,508
Senior debt (65%)
€3,445,942
Senior debt share
65%
Senior debt interest rate
8.5%
Senior debt tenor
12 Year
Neither EBRD nor IFC publishes margins or tenors for Ukrainian energy loans, so the 8.5% base-case rate is our estimate and not a sourced figure. The financing sensitivity below shows how much the answer depends on it.
Sensitivity analysis
Equity IRR versus evening capture price (€/MWh)
1602.2%
1805.5%
2059.6%
23013.8%
25518.2%
Equity IRR versus capital cost variance
-15%15.1%
-7.5%12.1%
Base9.6%
+7.5%7.5%
+15%5.6%
Equity IRR versus cycles per year
2704.8%
3007.2%
3309.6%
36512.4%
40015.3%
Equity IRR versus senior debt rate
5.5%12.1%
6.5%11.2%
7.5%10.4%
8.5%9.6%
9.5%8.8%
The captured evening price is by far the most influential variable, followed by capital cost. Below roughly €160/MWh of evening capture the base case stops clearing a plausible cost of equity, which is why the auction CfD route matters as a floor rather than merely as upside.
Optimistic case: blending grid energy in poor weather
The base case ties the battery to the solar field: it assumes 330 equivalent cycles a year, which is roughly the number of days on which the array can be relied on to fill it. That is deliberately conservative, and it understates what the asset can do.
Why poor weather does not stop the arbitrage
The midday collapse in Ukrainian prices is not caused by this plant. It is caused by every solar installation in the country generating at once against weak daytime demand. That price signal is a property of the national system, and it is still there on days when this particular site is under cloud. So on a dull day the battery does not sit idle waiting for sunshine — it buys from the grid during the same midday trough and sells into the same evening peak. The solar field stops being the source of energy and becomes a hedge against the cost of buying it.
What changes in the model
Optimistic case assumptions
Base case
Optimistic case
Equivalent full cycles per year
330
365
Evening discharge capture price
€205/MWh
€218/MWh
Blended midday charging cost
€25/MWh
€38/MWh
Energy delivered to grid
3,960 MWh
4,380 MWh
Energy bought from grid to charge
1,418 MWh
1,884 MWh
Share of charging met by own solar
68%
61%
Senior debt interest rate
8.5%
8.5%
Note the charging cost rises from €25 to €38/MWh, and that is intentional. On a genuinely overcast day the whole region generates less solar, so the midday trough is shallower and the energy costs more to buy. Penalising the charge price is what keeps this scenario honest: the extra throughput is bought at a thinner margin, not the same one.
The two levers are independent. Running the optimistic operating case on senior debt priced at 6.5% — the level implied by an EBRD or IFC facility carrying EU Ukraine Investment Framework first-loss cover, which is how every comparable Ukrainian transaction has been financed — lifts the levered return further:
Three things. First, sustained nationwide cloud would flatten the midday trough everywhere at once, and the spread would narrow rather than merely shift source. Second, grid-charged energy pays the full transmission charge of ₴713.68/MWh where behind-the-meter solar charging does not, so the margin on bought energy is structurally thinner and more exposed to a tariff increase. Third, cycling 365 times a year rather than 330 uses the battery harder; we have held capacity fade at 2% a year on the strength of the supplier warranty, but a higher throughput regime is the case in which that warranty matters most. We regard the base case, not this one, as the number to underwrite against.
Levelised cost of storage
€95/MWhLevelised cost of storage
Calculated on Ember’s energy-shifting basis at an 11% discount rate, excluding the cost of charging energy. This is the minimum spread the battery must capture to break even on the storage leg alone; the assumed spread of €180/MWh provides substantial headroom over it.
For context, Damodaran puts Ukraine’s total equity risk premium at 19.77% as of January 2026, and Ukrainian energy transactions typically target 14–16% equity IRR when senior debt carries an international financial institution guarantee. The larger project clears that band in the optimised case; the smaller one is positioned as a replicable pilot rather than a return-maximising vehicle.
8. Site layout and imagery
The layout below is drawn to scale from the indicative plot dimensions. Both sites follow the same arrangement: a technical strip along the northern boundary holding the battery compound, the power conversion skids, the control room and the metering substation, with the solar field occupying the remainder of the plot in blocks separated by maintenance roads. Placing the battery next to the substation keeps the medium-voltage cable runs short and allows both the battery and the solar field to share a single connection point, as permitted by Law 4213-IX.
Indicative site layout
Solar field Battery container PCS skid / Metering substation Control / O&M room Access road Perimeter fence
Metric
Value
Fenced plot
270 × 220 m — 5.9 ha
Solar field area
5.9 ha
Module table rows
26 (2 × 13)
Row pitch
5.6 m
Battery containers (20 ft)
3
PCS / MV transformer skids
1
Grid connection voltage
35 kV
Land use intensity
1.59 ha/MWp
Dimensions are indicative and subject to the final land survey, geotechnical investigation and the grid connection technical conditions. Row pitch of 5.6 m is set to limit inter-row shading at the winter solstice for a fixed-tilt system at this latitude; the final pitch will follow the PVsyst shading study. The battery compound is separately fenced and hardened, and storage flows are metered independently, which is a mandatory requirement for co-located assets.
Reference photography
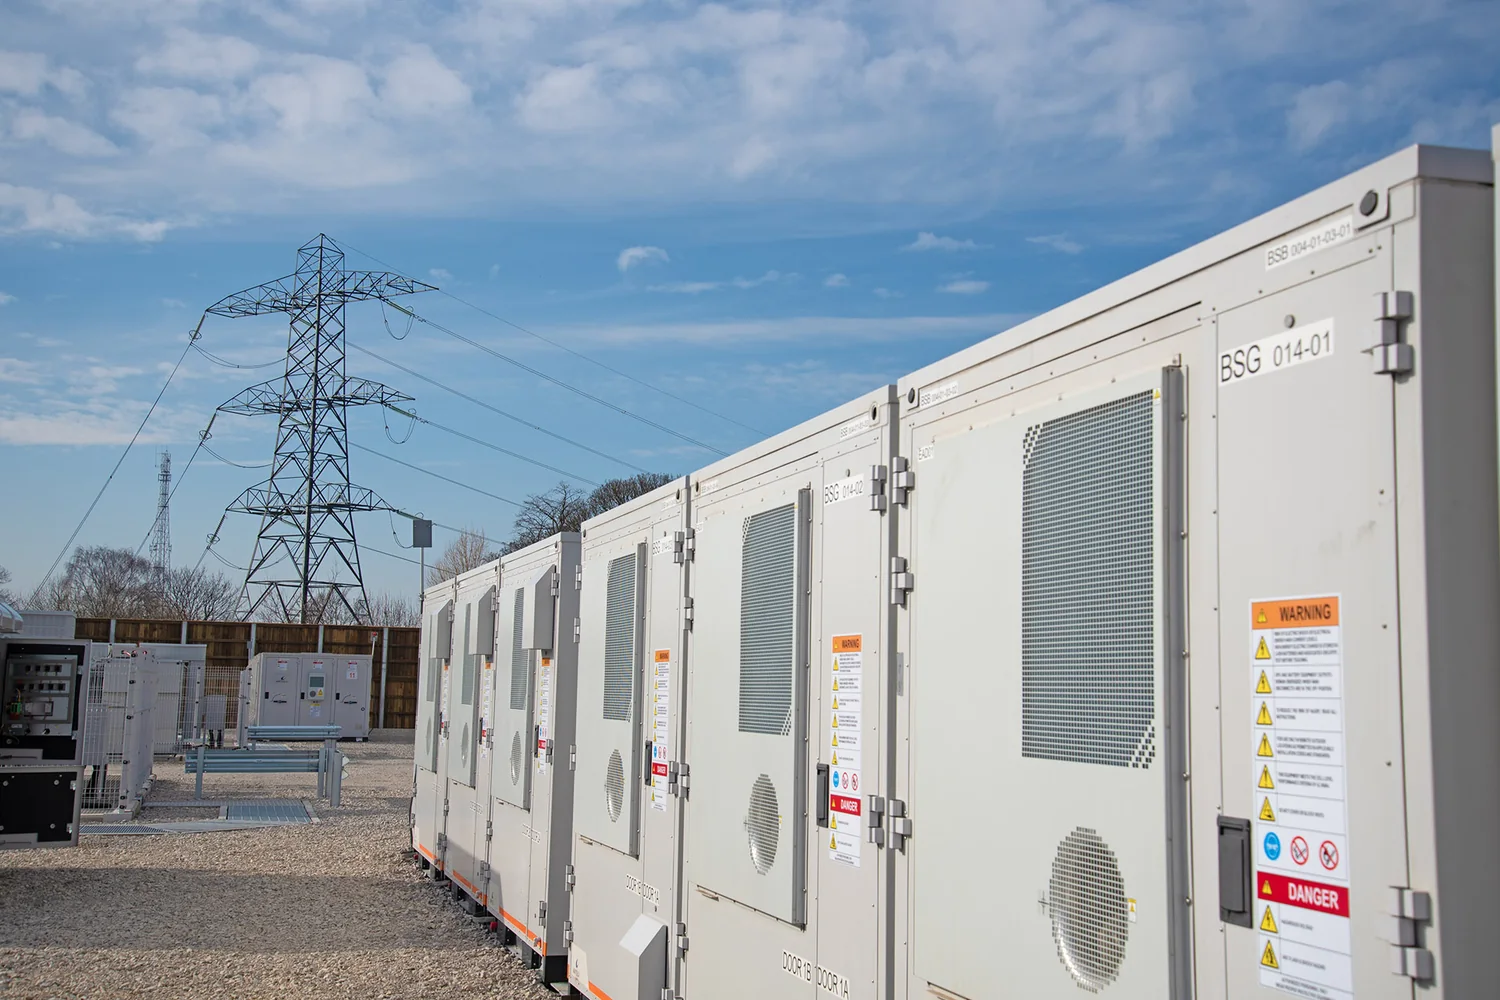
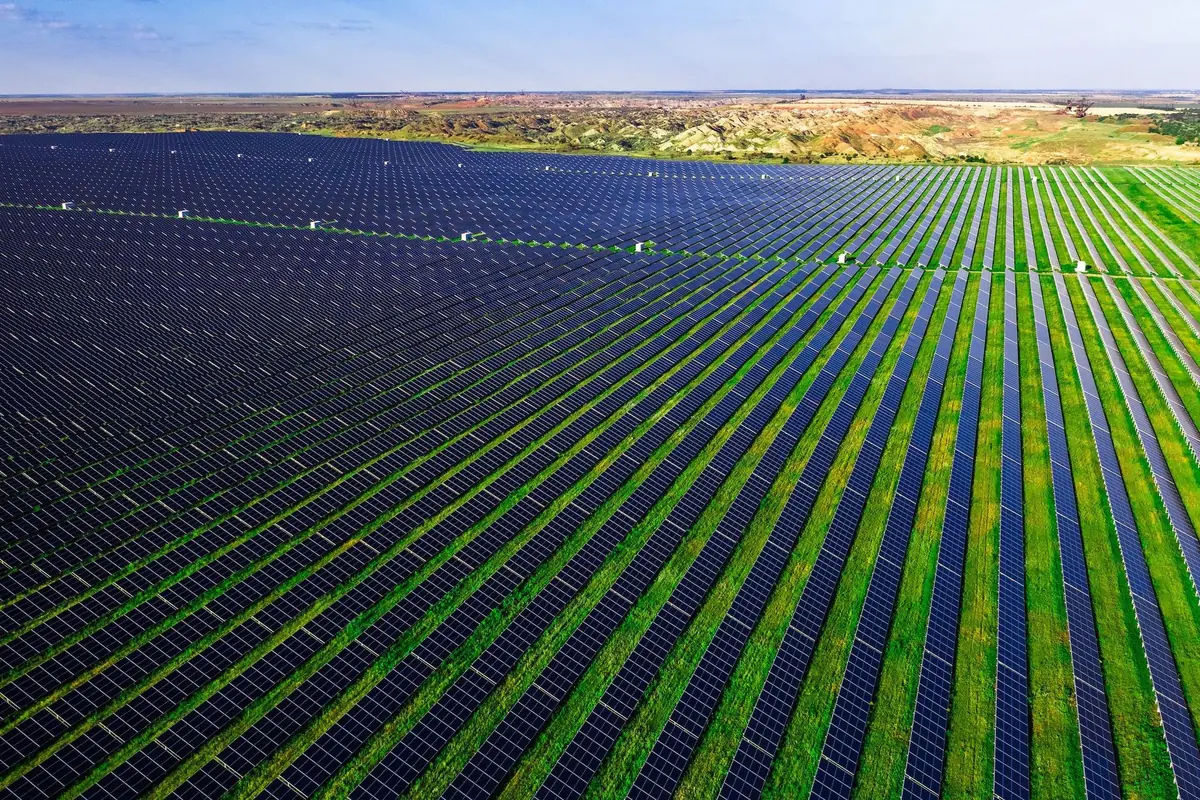
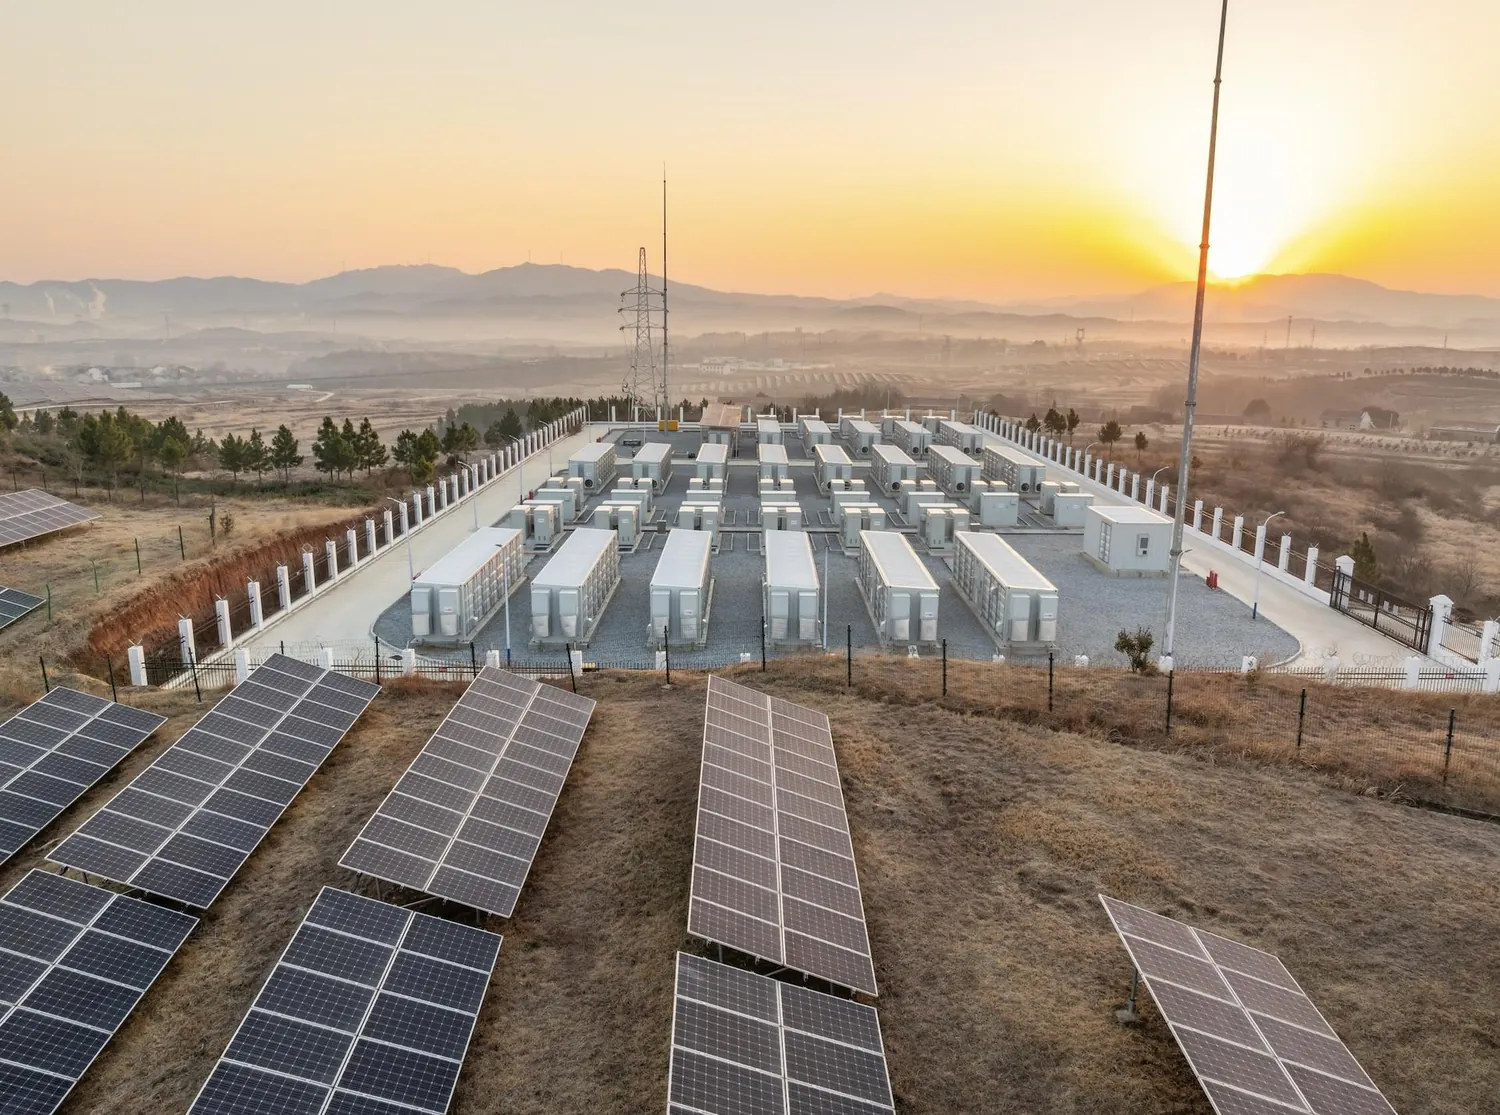
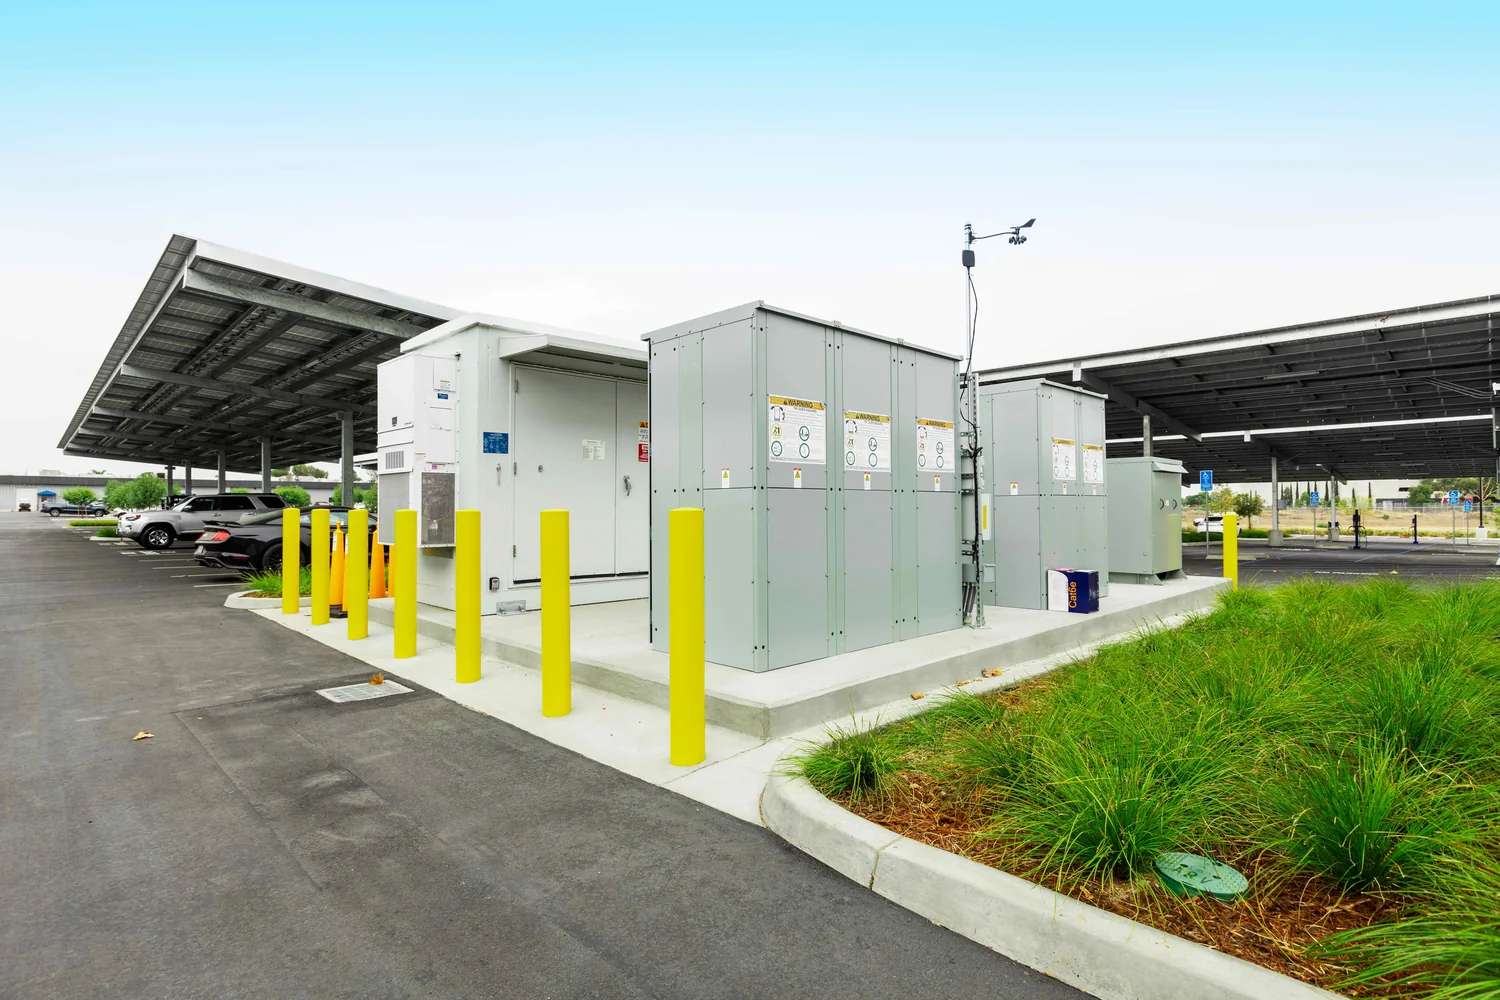
Co-located solar field and battery compound, seen from the airGround-mounted solar field, fixed-tilt rowsContainerised battery units inside the fenced compoundPower conversion and medium-voltage transformer skidPhotovoltaic module array, mounting detail
Photographs of comparable operating installations, included to show the physical form of the plant. They are not images of this site, which is not yet built.
9. Regulatory framework and permitting
Ukraine has moved quickly to make storage bankable. The provisions below are the ones that materially shape this project.
Storage licensing
Under Law 4777-IX, in force since March 2026, a storage licence is required only where a single site exceeds 5 MW. Both projects are at or below that threshold and therefore require no storage licence from the regulator.
Co-location behind one connection point
Law 4213-IX permits generation and storage to share a single grid connection and raised the licence-free generation threshold to 20 MW until 1 January 2028. Separate commercial metering of storage flows is mandatory and is included in the capital cost.
Solar-plus-storage auction category
A dedicated auction category reserves at least 10% of annual support volume for solar-plus-storage, with support running to 2034 and a ceiling of €0.12/kWh. Eligibility requires storage power of at least 80% of solar capacity and at least 2 kWh of storage per kW of solar. Both configurations were sized specifically to satisfy both tests.
Flexibility and capacity auction
Ukrenergo published draft documentation in July 2026 for a 1,505 MW tender for new manoeuvrable capacity across four regional lots, with five years of support and a ceiling of €0.2792/kWh. This is a potential second contracted revenue stream and is not counted in any of our three cases.
Taxation
Corporate income tax is 18%. Imported solar and storage equipment is exempt from VAT and customs duty. Accelerated depreciation permits machinery and equipment to be written off over two years until the end of 2030, which shelters early-year cash flow — this is reflected in the model. Dividends to a non-resident holder attract 15% withholding, reducible to 5% under the Ukraine–Cyprus treaty where the holder owns at least 20% of the shares.
Holding structure
A Ukrainian limited liability company holds the land lease, grid connection and permits, held in turn by an EU holding company through which investor capital is channelled. Dividend repatriation remains subject to National Bank of Ukraine martial-law restrictions, which is disclosed as an open item.
10. Risk register
The register below is deliberately blunt. Two risks are genuinely severe and are not fully mitigable at the project level.
Metric
Severity
Mitigation
Military and physical asset risk
High
Both sites are deliberately located away from the line of contact — Odesa oblast in the south-west and Poltava oblast in the interior, the latter several hundred kilometres from the front. Containers are dispersed, bermed and separately fenced, and physical security is budgeted at €35,000–45,000 per year. The risk cannot be eliminated: Ukrainian energy infrastructure has been targeted nationwide, including deep in the rear, and investors should assume a non-trivial probability of total loss.
War risk insurance availability
High
As of early 2026 commercial war-risk cover is effectively unavailable for Ukrainian energy infrastructure. The mitigation is a first-loss guarantee from the EU Ukraine Investment Framework or a multilateral political-risk product, and state compensation of up to ₴10m, which is de minimis at this project size. If no guarantee is secured, the equity absorbs this risk.
Merchant price and spread compression
Medium
As storage capacity builds out, the intraday spread will narrow. Mitigations are the auction CfD floor, the flexibility auction, and a four-hour duration that captures a wider window than a two-hour system. The sensitivity table quantifies the exposure directly.
Currency mismatch
Medium
Revenue is earned in hryvnia while debt and investor returns are in euro. Ukraine has no deep long-dated hedging market. Partly mitigated because wholesale prices have historically tracked euro-denominated import parity, and because the regulatory price cap is periodically revised upward.
Regulatory and price-cap change
Medium
The evening price cap is the single largest determinant of upside. Caps have been revised repeatedly, most recently upward in May 2026, and the policy direction has been towards liberalisation. A downward revision would compress returns materially.
Capital cost and supply chain
Medium
Fixed-price turnkey EPC contract with liquidated damages, procurement from tier-one suppliers, and a 10% contingency. Battery system prices have fallen 37% year-on-year in Europe, so the risk is skewed to the downside on cost.
Grid connection cost and timing
Low
The connection allowance is an estimate until the distribution system operator issues technical conditions. Co-locating behind the solar field’s existing connection point substantially limits exposure. Flagged as an open item before final investment decision.
Technology performance and degradation
Low
A 20-year supplier capacity warranty guaranteeing no more than 2% annual fade, with liquidated damages for round-trip efficiency shortfall. Cold-climate HVAC parasitic load is the least well characterised technical variable and is being modelled with the supplier.
The impact case for storage in Ukraine is unusually direct. Every megawatt-hour shifted from the midday solar surplus into the evening peak displaces generation that would otherwise come from fossil peaking plant or imports, and does so in the hours when the system is most stressed.
2,740 t CO₂eCO₂ displaced, annual equivalent
3,300Households supplied during the evening peak
2,982 MWh per yearSolar energy stored rather than curtailed or sold at near-zero prices
Grid resilience
Ukraine has lost a substantial share of its dispatchable capacity to sustained attack, and rolling disconnections have been a routine feature of recent winters. Distributed storage is among the fastest and most defensible ways to restore evening peak capacity, which is why it is a priority for the Energy Community, the EBRD and the EU Ukraine Investment Framework.
13. Assumptions, sources and disclaimer
Every quantitative claim on this page traces to one of the sources below or to the financial model built on them. Where a figure could not be verified from a primary source we have said so in the relevant section rather than presenting an estimate as a fact.
All euro figures converted at €1 = ₴51.0, the mid-market rate for July 2026.
Open items before final investment decision
Four inputs remain unverified and are flagged rather than smoothed over: the definitive grid connection fee from the distribution system operator; the senior debt margin and tenor, which no international financial institution publishes for Ukraine; the insurability of the asset against war risk, which is currently doubtful; and cold-climate HVAC parasitic load, for which we are using a generic 2–4% of throughput pending supplier modelling.
This document is provided for information only and is not an offer to sell or a solicitation to buy securities, nor is it investment, legal or tax advice. Forward-looking figures are modelled projections based on the stated assumptions and will differ from actual results. Ukrainian energy projects carry risks that include, without limitation, armed conflict, destruction of assets, currency inconvertibility, regulatory change and counterparty default. Investors may lose the entire amount invested. Prospective investors should take independent advice and satisfy themselves as to the accuracy of every assumption before committing capital.