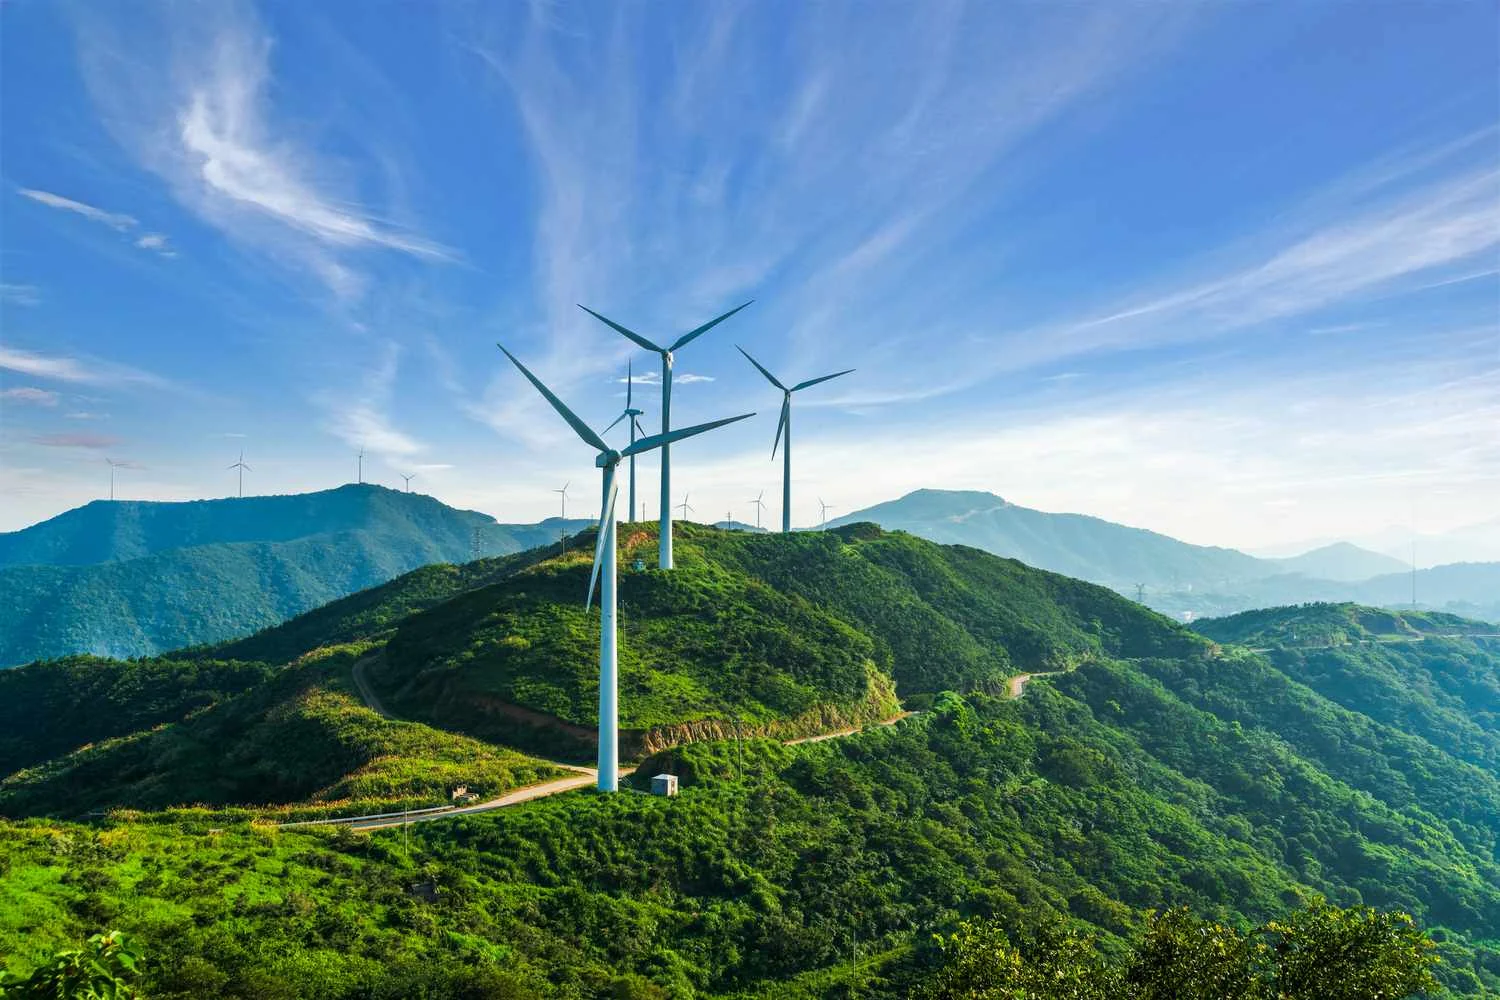
30 MW ridge wind farm at 1,100 m in the Ukrainian Carpathians. Winter-peaking generation that complements the summer-peaking solar projects, on the safest terrain in the country and inside the ENTSO-E-synchronous Burshtyn island.
Complete project documentation for institutional and retail investors. Every figure below is derived from the financial model summarised on this page; primary sources are listed at the end.
1. Executive summary
A 30 MW wind farm of five 6.0 MW turbines on an exposed Carpathian ridge at about 1,100 m in Ivano-Frankivsk oblast, connected at 110 kV inside the Burshtyn Energy Island. We should be blunt about the trade-off at the centre of this project: the Carpathians are not Ukraine’s best wind resource. The southern steppe has 7–8 m/s at 100 m and materially cheaper construction. What the Carpathians offer instead is safety, grid access and seasonal fit — and in wartime Ukraine those are worth paying for. The base case returns 12.1% to equity with a minimum DSCR of 1.56x over a 14-year debt tenor.
€49,610,000Total capital cost
12.1%Equity IRR (levered)
1.56xMinimum DSCR
30 MWTotal installed capacity
30.1%Net capacity factor
79,058 MWhNet generation, year 1
€19,844,000Equity tranche
€29,766,000Senior debt (65%)
€5,788,465Year-1 EBITDA
10.6%Project IRR (unlevered)
€2,226,672NPV at 10% discount rate
8.8 YearSimple payback
€110/MWhLevelised cost of energy
25 YearDesign life
2. Why the Carpathians, given the wind is better elsewhere
Four reasons this site is worth developing despite a mediocre wind resource, and one reason it very nearly is not.
It is the safest ground in Ukraine
Ivano-Frankivsk oblast is the furthest region in the country from the line of contact and has seen the least damage to energy infrastructure. For an asset with a 25-year design life financed over 14 years, that matters more than a percentage point of capacity factor. The southern steppe sites with the best wind are also the ones that have been shelled.
It sits inside the Burshtyn Energy Island
The UA-BEI zone around Burshtyn has been operated synchronously with Continental Europe since long before the 2022 emergency synchronisation of the rest of the country. Generation here has physical access to Hungarian, Slovak and Romanian markets, which is a genuine export option and a hedge against domestic price and counterparty risk.
Winter generation complements the solar projects
Carpathian wind peaks in winter, precisely when Ukrainian prices are highest — the December 2025 day-ahead index was €130/MWh against a €104/MWh full-year average — and precisely when the solar-plus-storage projects are weakest. A portfolio holding both is far less seasonal than either alone.
Wind captures price far better than solar in Ukraine
Solar in Ukraine cannibalises its own price: it generates in the midday hours when prices collapse towards zero, which is the entire reason the storage projects exist. Wind does not. It generates through the night and the evening peak, when there is no solar on the system and prices are at their highest. We model a capture price of €105/MWh against a base index of about €104/MWh — roughly parity — where unstored solar captures barely a third of that.
The argument against
Complex-terrain construction is expensive and the resource is average, so the levelised cost of energy comes out at €110/MWh. That is far above the $30–40/MWh at which onshore wind is quoted globally, and above what a steppe site in Mykolaiv oblast would achieve. This project is not competitive on cost of energy. It is competitive on risk-adjusted deliverability, and an investor who does not accept that framing should not invest in it.
3. Wind resource and energy yield
The Carpathian wind resource is strongly altitude-dependent. Valley floors average only 1.0–3.7 m/s and are worthless for generation, but wind speed rises almost linearly with elevation above roughly 600 m, and exposed crests above 1,000 m become viable. Our site is selected on that basis.
Metric
Value
Mean wind speed at hub height
6.8 m/s
Crest elevation
1,100 m
Hub height
120 m
Rotor diameter
150 m
Specific power
340 W/m²
Gross capacity factor
36.5%
Net capacity factor
30.1%
Net generation, year 1
79,058 MWh
Equivalent full-load hours
2,635 h
Gross-to-net loss waterfall
36.5% Gross capacity factor→30.1% Net capacity factor
Wake losses between turbines−3.5%
Complex-terrain turbulence and flow distortion−3.0%
Winter icing and blade contamination−4.5%
Turbine unavailability (96% availability)−4.0%
Electrical and transformer losses−2.0%
Grid curtailment in the local network−2.0%
The icing allowance of 4.5% deserves attention because it is the loss most often understated in Carpathian feasibility work. Rime ice at 1,100 m degrades the blade profile before it ever trips the turbine, and the losses accumulate through exactly the winter months that carry the highest prices. We have used a generic figure; a site-specific icing assessment from the met mast campaign is a condition precedent, not a nice-to-have.
The 6.8 m/s mean is an estimate from mesoscale data and regional altitude relationships, not a measurement. A 12-month met mast campaign at hub height, producing a bankable P50 and P90 energy yield assessment, is the single most important open item in this project — the sensitivity table shows why. No lender will fund construction without it, and neither should an equity investor.
4. Turbine configuration
A conventional low-specific-power onshore machine, chosen for a medium-wind, high-turbulence site.
Metric
Value
Turbines
5
Rated power per turbine
6.0 MW
Total installed capacity
30 MW
Hub height
120 m
Rotor diameter
150 m
Turbine spacing along the crest
600 m (4.0 D)
IEC turbulence class
IEC IIIB / S — site-specific suitability assessment required
Onshore wind is quoted globally at $1,150–1,800/kW, the upper end reflecting constrained logistics and difficult terrain. This project lands at €1,654/kW, near that upper end, and the reason is visible in the cost lines: mountain roads, rock foundations and a 14 km line.
Turbine supply, transport and erection€34,500,00069.5%
Foundations, crane pads and hardstands (rock excavation)€3,600,0007.3%
Mountain access track — new build and upgrade€2,200,0004.4%
Site substation and 14 km 110 kV overhead line€3,200,0006.5%
Development, EIA, met mast, permitting, legal and financing fees€1,600,0003.2%
Contingency (10%)€4,510,0009.1%
Amount / Share
Total
€49,610,000
Capital cost per kW installed
€1,654/kW
Import VAT and customs duty
Exempt for solar and storage equipment (Laws 3853-IX and 3854-IX)
The scale of this project is a deliberate consequence of that cost structure. Roads, the grid connection and development are largely fixed on a mountain site, so they have to be spread across as much capacity as the ridge will hold. We modelled an 18 MW version first: it produced €1,751/kW and, more seriously, a downside-case DSCR of 0.93 — a project that cannot service its own debt in a weak wind year. At 30 MW the same downside clears 1.09x. Thirty megawatts is not an ambition here, it is the minimum viable size.
6. Revenue and operating costs
Revenue is a single stream: energy sold into the day-ahead and intraday markets, or under a corporate PPA. There is no arbitrage and no storage, which makes this project far simpler to model than the battery projects — and far more exposed to the wind resource.
Metric
Value
Net generation
79,058 MWh
Capture price
€105/MWh
Year-1 revenue
€8,301,056
The €105/MWh capture price is approximately the 2025 full-year base index of €103.8/MWh. We are assuming wind captures at parity with base — no better. That is conservative for a winter-weighted generator in a market where winter prices run 25% above the annual average, and it deliberately leaves the export and PPA upside out of the base case.
Operating costs, year 1
Metric
Amount
Full-service turbine O&M contract (€48/kW/yr)
€1,440,000
Imbalance and balancing market costs (€6/MWh)
€474,346
Insurance (0.4% of capital cost)
€223,245
Asset management and SPV administration
€150,000
Physical security and site protection
€75,000
Land lease and forest use fees
€90,000
Community benefit fund and municipal levies
€60,000
Total operating costs
€2,512,591
The €6/MWh balancing cost is real and specific to wind. Unlike the battery projects, which are dispatchable and can trade themselves out of imbalance, a wind farm pays for forecast error. Ukrainian imbalance settlement is unforgiving, and this line grows if forecasting is poor.
From revenue to EBITDA
€8,301,056Year-1 revenue
− €2,512,591Total operating costs
€5,788,465Year-1 EBITDA
7. Returns, financing and sensitivity
Three scenarios on the same capital structure. Note that the downside case is not comfortable, and we have not dressed it up.
Base case — merchant at parity capture
Project IRR (unlevered)10.6%
Equity IRR (levered)12.1%
Minimum DSCR1.56x
Simple payback8.8 Year
30.1% net capacity factor, €105/MWh capture, 60% gearing at 8.5% over 14 years.
Optimistic case — upper resource band and PPA
Project IRR (unlevered)14.3%
Equity IRR (levered)19.4%
Minimum DSCR2.03x
Simple payback6.9 Year
Year-1 revenue uplift, optimistic case+22.0%
A 33.5% net capacity factor, achievable if the met mast confirms the upper resource band and the cold-climate package limits icing losses, combined with a €115/MWh winter-weighted capture price or a corporate PPA at that level.
Downside case — weak wind year at the auction floor
Equity IRR (levered)5.2%
Minimum DSCR1.09x
Simple payback12.2 Year
A 28.3% capacity factor and €88/MWh capture. Equity returns almost nothing and DSCR falls to 1.09x. The project still services its debt, but only just, and this is the scenario that determines the gearing.
Capital structure
Metric
Value
Total capital cost
€49,610,000
Equity tranche
€19,844,000
Senior debt (65%)
€29,766,000
Senior debt share
60%
Senior debt interest rate
8.5%
Senior debt tenor
14 Year
Neither EBRD nor IFC publishes margins or tenors for Ukrainian energy loans, so the 8.5% base-case rate is our estimate and not a sourced figure. The financing sensitivity below shows how much the answer depends on it.
Equity IRR, optimistic case + concessional debt
As with the storage projects, the operating case and the financing are independent levers. Running the optimistic case on senior debt at 6.5%, the level implied by an EBRD or IFC facility with EU Ukraine Investment Framework first-loss cover, lifts the levered return further.
20.9%Equity IRR, optimistic case + concessional debt
2.29xMinimum DSCR
1.9 YearPayback shortened by
Sensitivity analysis
Equity IRR versus capture price (€/MWh)
855.8%
959.0%
10512.1%
12016.9%
13522.0%
Equity IRR versus net capacity factor
25%6.9%
28%10.0%
30.1%12.1%
33%15.2%
36%18.4%
Equity IRR versus capital cost variance
-15%16.4%
-7.5%14.1%
Base12.1%
+7.5%10.5%
+15%9.1%
Equity IRR versus senior debt rate
5.5%14.1%
6.5%13.4%
7.5%12.8%
8.5%12.1%
9.5%11.5%
Capacity factor and capture price dominate, and they are the two variables we know least precisely before the met mast campaign completes. A three-percentage-point miss on capacity factor costs roughly two points of equity IRR. This is the ordinary condition of a pre-mast wind project and it is why the resource assessment, not the turbine procurement, is the critical path.
Levelised cost of energy
€110/MWhLevelised cost of energy
€100/MWhOptimistic case — upper resource band and PPA
Calculated at an 11% discount rate over 25 years. At €110/MWh this project is expensive by international onshore wind standards and would not be built in Germany or Spain. It works here because Ukrainian wholesale prices are high, the regulatory price cap is ₴15,000/MWh, and the alternative sites with better wind carry war risk this one does not.
8. Site layout and imagery
Five turbines are arranged along the crest at 600 m centres — four rotor diameters, wide enough to keep wake losses low on a ridge where the wind comes predominantly across the slope. A single access track threads the positions and the site substation sits at the lower eastern end, where the 110 kV line leaves for the grid.
Indicative layout and elevation
Elevation through the ridge (vertical scale exaggerated)
Metric
Value
Leased ridge corridor
3.0 × 0.8 km
Turbine spacing
600 m (4.0 D)
Blade tip height above ground
195 m
Access track, new and upgraded
8.5 km
Overhead line to grid connection
14 km
Connection voltage
110 kV
Turbine positions are indicative. Final micro-siting follows the met mast campaign, the site-specific turbulence assessment and the environmental screening, any of which can move a position by a few hundred metres or remove it. The elevation inset is drawn with an exaggerated vertical scale so the machines are legible; horizontal distances in the plan view are to scale.
Reference photography
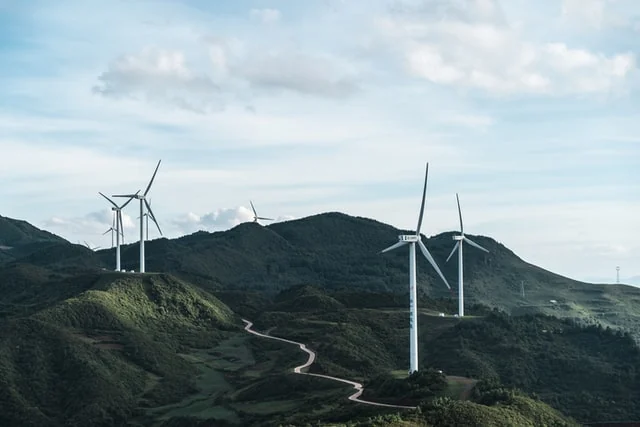
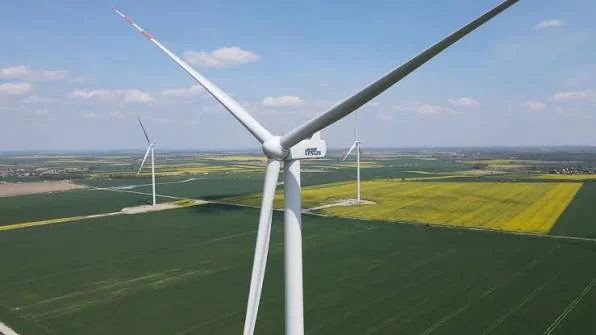
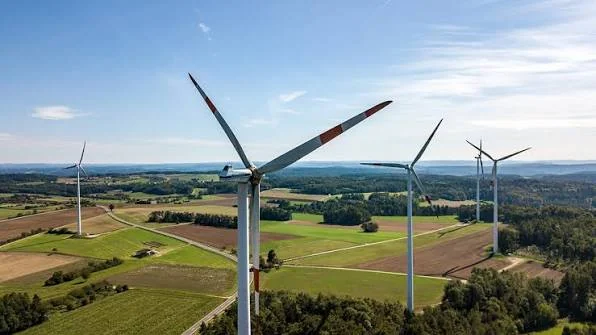
Turbines on an exposed mountain ridgeMountain access track serving ridge turbine positionsTurbine tower and nacelle at close rangeMultiple turbines in open rolling terrain, showing array scale
Photographs of comparable ridge-sited wind installations, included to show the physical form of the plant. They are not images of this site, which is not yet built.
9. Regulatory framework and permitting
Wind in the Carpathians is legally straightforward and environmentally contentious. The second of those is the real constraint.
Permitting and land
The licence-free generation threshold was raised to 20 MW until 1 January 2028, so at 30 MW this project requires a generation licence from the regulator. Ridge land is typically state forest fund, which means a forest use conversion in addition to the land lease — a slower and more political process than the agricultural leases used by the solar projects.
Environmental assessment
A full environmental impact assessment with public hearings is mandatory. Carpathian sites additionally engage the Carpathian Convention, Emerald Network designations, and bird and bat migration corridors along the ridge lines. Members of the European Parliament have publicly criticised wind development in the Ukrainian Carpathians over deforestation, and Ukraine has faced pointed questions about clearing forest for turbines while receiving international money to conserve it. Any developer here should expect organised opposition and should plan for it rather than be surprised by it.
Auction support
Wind is eligible for the state renewables auction, and separately for the 1,505 MW flexible capacity tender. Neither is assumed in the base case; the auction price acts as the floor modelled in the downside scenario.
Grid connection
Connection at 110 kV into the UA-BEI network. The local network is weaker than the trunk system, which is why we carry a 2% curtailment allowance in the loss waterfall. Definitive capacity and cost come with the technical conditions from the system operator.
Taxation
Corporate income tax is 18%. Imported solar and storage equipment is exempt from VAT and customs duty. Accelerated depreciation permits machinery and equipment to be written off over two years until the end of 2030, which shelters early-year cash flow — this is reflected in the model. Dividends to a non-resident holder attract 15% withholding, reducible to 5% under the Ukraine–Cyprus treaty where the holder owns at least 20% of the shares.
Holding structure
A Ukrainian limited liability company holds the land lease, grid connection and permits, held in turn by an EU holding company through which investor capital is channelled. Dividend repatriation remains subject to National Bank of Ukraine martial-law restrictions, which is disclosed as an open item.
10. Risk register
Metric
Severity
Mitigation
Wind resource uncertainty — no met mast data yet
High
The energy yield rests on mesoscale modelling, not measurement. A 12-month hub-height met mast campaign producing a bankable P50/P90 assessment is a condition precedent to final investment decision. Until it completes, treat the capacity factor as an estimate with a plausible range of ±3 percentage points, which the sensitivity table translates into roughly ±2 points of equity IRR.
Environmental opposition and permitting delay
High
Carpathian wind development is actively contested on deforestation and biodiversity grounds, including at European Parliament level. Mitigation is early and genuine engagement with communities and conservation bodies, siting outside Emerald Network parcels, a funded community benefit scheme, and a permitting programme with realistic float. This risk can delay or kill the project outright and cannot be fully mitigated by the developer.
Military and physical asset risk
High
Ivano-Frankivsk oblast is the lowest-exposure region in Ukraine, which is a principal reason for the site selection, but no location in the country is safe from long-range strikes and turbines are difficult to repair. War risk insurance remains effectively unavailable for Ukrainian energy infrastructure; the mitigation is an IFI first-loss guarantee, and absent one the equity carries this risk.
Icing and winter performance
Medium
A 4.5% icing loss is assumed. Rime ice at 1,100 m reduces yield in the highest-price months and is commonly underestimated. Mitigations are a cold-climate turbine package with blade heating and ice detection, and a site-specific icing study from the mast campaign.
Complex-terrain construction cost and access
Medium
Mountain roads, rock foundations and crane access on steep ground are the cost lines most likely to overrun, and blade transport to 1,100 m constrains the turbine model. Mitigations are a fixed-price turnkey EPC contract with liquidated damages, early geotechnical investigation and a route survey before the turbine is selected. A 10% contingency is carried.
Merchant price and capture risk
Medium
Revenue is a single unhedged stream. Mitigations are the auction price as a floor, a corporate PPA with an industrial offtaker in the Burshtyn zone, and the export option to Hungary and Slovakia. The downside case models this directly.
Grid curtailment and connection capacity
Medium
The UA-BEI network is comparatively weak. A 2% curtailment allowance is carried; definitive capacity comes with the technical conditions. Co-locating storage at the substation is the obvious later-phase mitigation and would also lift capture price.
Currency mismatch
Low
Revenue in hryvnia against euro debt and euro investor returns, with no deep long-dated hedging market. Partly offset because Ukrainian wholesale prices track euro-denominated import parity and the regulatory cap is revised upward periodically.
11. Implementation timeline
Months 1–14Met mast installed and 12-month measurement campaign completed; bankable energy yield assessment issued
Months 6–18Land lease and forest use conversion, environmental impact assessment and public hearings, grid connection technical conditions
Months 24–33Access track construction, foundations and crane pads, substation and 110 kV line
Months 33–39Turbine delivery and erection, commissioning, grid code compliance testing
Month 39 onwardCommercial operation, performance verification against the yield assessment, quarterly investor reporting
12. Impact and ESG
Thirty megawatts of winter-peaking capacity in the region of Ukraine least exposed to attack is a direct contribution to national energy security, not only to decarbonisation. The honest counterweight is that ridge construction in the Carpathians has a real ecological cost, and that cost should be stated alongside the benefit.
33,204 t CO₂eCO₂ displaced, annual
24,706Households supplied
79,058 MWhAnnual generation
1,862,279 MWh25-year generation
The ecological cost
Access tracks and turbine platforms on a forested ridge require felling, fragment habitat and alter mountain hydrology, and ridge lines are bird and bat migration corridors. These effects are permanent for the life of the asset and partially permanent afterwards. Mitigation — micro-siting away from sensitive parcels, seasonal shutdown protocols during migration, compensatory afforestation and a funded community benefit scheme — reduces but does not eliminate them. Investors who weight biodiversity heavily should know that this project is a harder ESG case than the solar-plus-storage projects, which sit on farmland.
13. Assumptions, sources and disclaimer
Every quantitative claim on this page traces to one of the sources below or to the financial model built on them. Where a figure could not be verified from a primary source we have said so in the relevant section rather than presenting an estimate as a fact.
All euro figures converted at €1 = ₴51.0, the mid-market rate for July 2026.
This document is provided for information only and is not an offer to sell or a solicitation to buy securities, nor is it investment, legal or tax advice. Forward-looking figures are modelled projections based on the stated assumptions and will differ from actual results. Ukrainian energy projects carry risks that include, without limitation, armed conflict, destruction of assets, currency inconvertibility, regulatory change and counterparty default. Investors may lose the entire amount invested. Prospective investors should take independent advice and satisfy themselves as to the accuracy of every assumption before committing capital.